10.2 K-means聚类算法的实现
1. 数据集
scikit中的make_blobs方法常被用来生成聚类算法的测试数据,直观地说,make_blobs会根据用户指定的特征数量、中心点数量、范围等来生成几类数据,这些数据可用于测试聚类算法的效果。
sklearn.datasets.make_blobs(n_samples=100, n_features=2, centers=3, cluster_std=1.0, random_state=None)其中:
n_samples是待生成的样本的总数。
n_features是每个样本的特征数。
centers表示类别数。
cluster_std表示每个类别的标准差。
random_state表示随机数状态,保证多次调用时产生数据集的一致性。
例:生成4类数据用于聚类(500个样本,每个样本有2个特征)
from sklearn.datasets import make_blobs
X, y = make_blobs(n_samples=500,
                   centers=4,
                   cluster_std=0.6,
                   random_state=0)
import matplotlib.pyplot as plt
plt.scatter(X[:,0],X[:,1])
plt.show()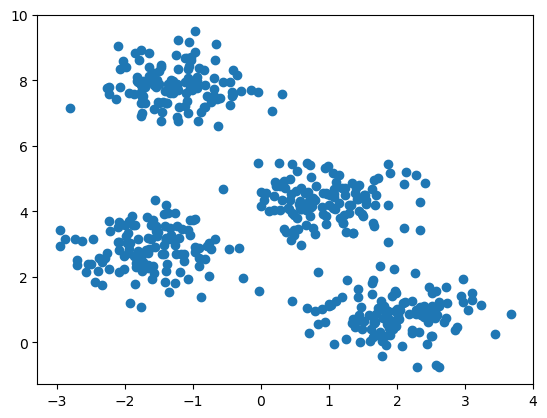
2. 模型
使用sklearn机器学习库下的cluster模块的KMeans类来完成聚类算法的调用:
from sklearn.cluster import KMeans

model = KMeans(n_clusters=4, random_state=0)
其中:
**n_clusters:**KMeans聚类算法的K,也就是聚类的簇数
**random_state:**保证每次运行结果一致
我们加载KMeans算法,并训练,训练完成后,模型会告诉我们聚成的4个类的中心,它的坐标是多少。
加载KMeans算法,生成模型
训练模型
查看中心点的坐标
查看聚类的结果
from sklearn.cluster import KMeans
model = KMeans(n_clusters=4, random_state=0, n_init=10)
model.fit(X)
centers_init = model.cluster_centers_centers_initarray([[ 1.9896518 , 0.85486599],
[-1.62397851, 2.84672953],
[-1.23719873, 7.85161617],
[ 0.94866739, 4.33099426]])model.labels_array([0, 0, 3, 3, 0, 1, 1, 3, 3, 2, 1, 0, 1, 2, 3, 3, 0, 3, 2, 3, 3, 0,
1, 2, 3, 2, 0, 1, 2, 1, 1, 1, 0, 1, 1, 0, 2, 3, 2, 0, 2, 3, 3, 0,
1, 0, 3, 3, 0, 0, 2, 2, 1, 3, 3, 1, 1, 2, 2, 0, 0, 2, 0, 0, 0, 1,
3, 0, 3, 1, 2, 3, 2, 0, 2, 0, 1, 1, 3, 3, 2, 3, 2, 3, 3, 1, 2, 2,
0, 2, 2, 2, 0, 2, 3, 3, 0, 0, 0, 3, 2, 2, 0, 2, 3, 3, 1, 0, 3, 2,
2, 1, 2, 2, 0, 2, 0, 3, 1, 0, 3, 2, 0, 0, 2, 0, 0, 0, 0, 2, 3, 2,
1, 2, 2, 2, 3, 0, 3, 1, 0, 0, 0, 0, 1, 2, 3, 3, 1, 2, 2, 0, 3, 3,
3, 1, 1, 0, 1, 3, 0, 3, 0, 0, 1, 1, 0, 3, 2, 1, 0, 2, 0, 1, 3, 2,
3, 2, 2, 2, 0, 0, 0, 3, 1, 2, 1, 0, 1, 2, 0, 1, 2, 1, 1, 2, 3, 1,
3, 2, 2, 3, 1, 1, 3, 1, 1, 3, 1, 1, 1, 0, 0, 0, 3, 0, 1, 2, 2, 2,
3, 0, 1, 2, 1, 0, 2, 3, 2, 1, 1, 1, 1, 1, 3, 3, 3, 1, 2, 0, 0, 1,
1, 0, 2, 2, 3, 0, 3, 3, 3, 1, 0, 2, 3, 2, 2, 1, 2, 1, 3, 3, 0, 2,
0, 0, 3, 3, 2, 0, 3, 2, 0, 1, 0, 2, 1, 1, 3, 0, 0, 3, 0, 1, 0, 1,
1, 0, 3, 3, 3, 0, 2, 2, 0, 2, 2, 2, 3, 0, 0, 2, 3, 2, 0, 0, 1, 2,
2, 3, 2, 3, 0, 3, 2, 1, 2, 1, 1, 3, 3, 3, 1, 1, 2, 0, 3, 1, 2, 0,
3, 3, 0, 0, 1, 0, 1, 1, 3, 1, 2, 0, 0, 3, 1, 3, 0, 0, 0, 0, 3, 0,
3, 0, 3, 3, 2, 0, 3, 2, 2, 1, 3, 0, 0, 1, 1, 0, 1, 2, 3, 3, 3, 2,
3, 1, 3, 2, 2, 3, 2, 2, 1, 2, 2, 1, 1, 1, 1, 2, 2, 2, 2, 0, 2, 0,
3, 0, 2, 3, 0, 3, 0, 3, 1, 1, 2, 3, 2, 1, 3, 0, 2, 1, 3, 0, 2, 1,
1, 3, 0, 3, 0, 1, 0, 3, 0, 2, 1, 0, 2, 0, 3, 1, 3, 1, 0, 2, 3, 3,
1, 0, 0, 3, 3, 1, 3, 1, 2, 0, 1, 0, 2, 1, 1, 1, 2, 1, 3, 2, 1, 1,
1, 1, 1, 3, 2, 0, 1, 0, 3, 0, 1, 2, 3, 2, 1, 2, 3, 2, 3, 1, 1, 2,
1, 1, 1, 2, 0, 1, 1, 2, 3, 1, 1, 3, 0, 2, 2, 3], dtype=int32)3. 绘图
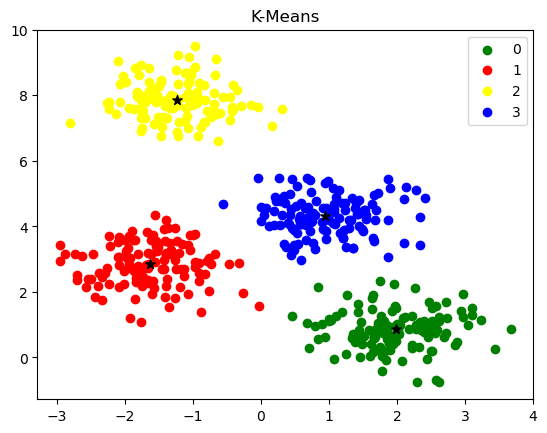
然后,绘图观察KMeans聚类算法是否达到了我们的预期
import matplotlib.pyplot as plt

fig, ax = plt.subplots()
colors = ['green', 'red', 'yellow', 'blue']

for k, col in enumerate(colors):
    ax.scatter(X[model.labels_==k, 0], X[model.labels_==k, 1], label=k,
                c=col)

ax.scatter(centers_init[:, 0], centers_init[:, 1], c='black', marker='*', s=50)
ax.legend()
ax.set_title("K-Means")
plt.show()