附录:matplotlib绘制多个子图
创建包含一个或多个子图(subplot)的图形,使用 plt.subplots方法:
nrows - 子图的行数
ncols - 子图的列数
fig, ax = plt.subplots(nrows=2, ncols=1, figsize=(6,3))
X = np.linspace(0, 15, 100)
Y1, Y2 = np.sin(X), np.cos(X)
ax[0].plot(X, Y1, color='C1')
ax[1].plot(X, Y2, color='C0')
plt.show()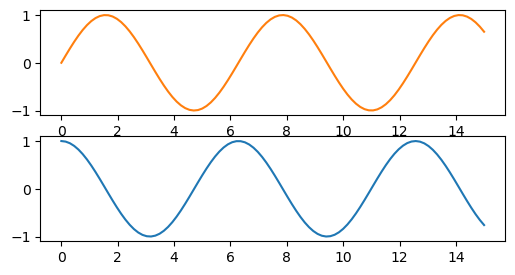
fig, (ax1, ax2)  = plt.subplots(nrows=1, ncols=2, figsize=(6,2))
X = np.linspace(0, 15, 100)
Y1, Y2 = np.sin(X), np.cos(X)
ax1.plot(Y1, X, color='C1')
ax2.plot(Y2, X, color='C0')
plt.show()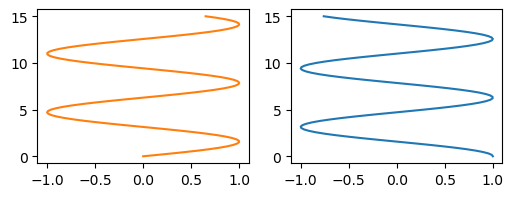
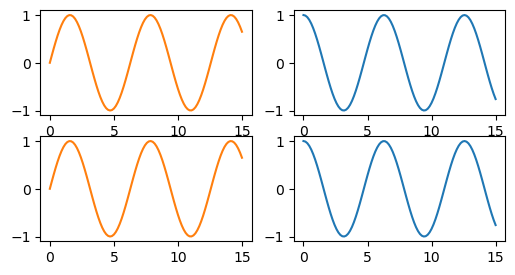
fig, ax = plt.subplots(nrows=2, ncols=2, figsize=(6,3))
X = np.linspace(0, 15, 100)
Y1, Y2 = np.sin(X), np.cos(X)
ax[0, 0].plot(X, Y1, color='C1')
ax[0, 1].plot(X, Y2, color='C0')
ax[1, 0].plot(X, Y1, color='C1')
ax[1, 1].plot(X, Y2, color='C0')
plt.show()