附录:在jupyter中显示无损图形
如果想要在当前的jupyter页面绘制图形时,显示无损格式,可以设置了输出图形的格式为SVG(Scalable Vector Graphics)。SVG是一量图形格式,可以无损地缩放和放大,适用于在不同分辨率的设备上显示。
使用SVG格式前:
import matplotlib.pyplot as plt
import numpy as np

plt.figure(figsize=(6,2))
X = np.linspace(0, 15, 100)
Y = np.sin(X)
plt.plot(X, Y)
plt.text(7, 0, 'Y = sin(X)')
plt.ylabel('Y')
plt.xlabel('X')
plt.grid()
plt.show()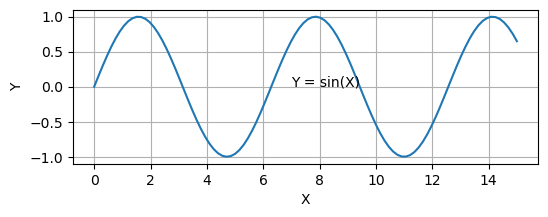
使用SVG格式后:
from matplotlib_inline import backend_inline
backend_inline.set_matplotlib_formats('svg')
plt.figure(figsize=(6,2))
X = np.linspace(0, 15, 100)
Y = np.sin(X)
plt.plot(X, Y)
plt.text(7, 0, 'Y = sin(X)')
plt.ylabel('Y')
plt.xlabel('X')
plt.grid()
plt.show()Loading...